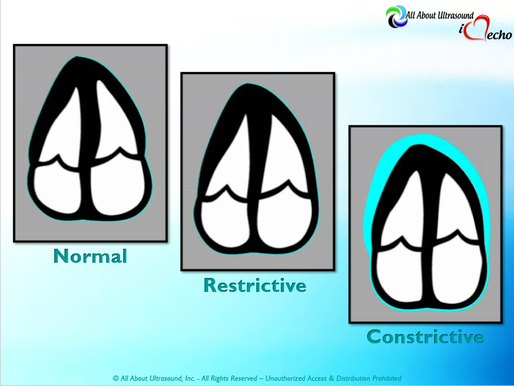
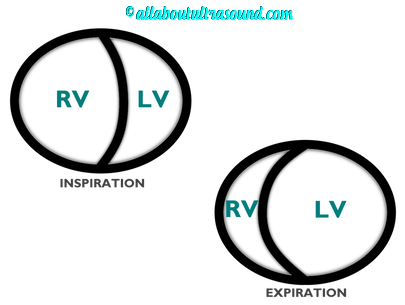
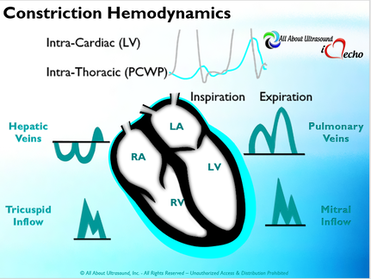
So with constriction the thorax pressure and the pulmonary venous pressure will drop, but there are phasic filling differences within the heart, because the gradient to fill the left side of the heart is decreased. The heart is no longer able to push outward against the pericardium, so the pressure is forced inward into the cardiac chambers. So during expiration, the pressure in the right atrium causes flow reversal in the hepatic veins. Whereas, with chronic late stages of restriction, there is an inspiratory reversal during diastole, because there is no shifting of septum and the right heart cannot accommodate increased flow which results from chronic diastolic dysfunction and this causes hepatic vein reversal. So while diagnosing Constrictive Pericarditis on echocardiography can certainly be a challenge, it can be done with confidence. Paying close attention to the details and recognizing when your patient with heart failure symptoms might actually be more than meets the eye, can help to make the correct diagnosis and ensure adequate treatment for your patient.
REFERENCES
Ling LH, Oh JK, Schaff HV et al. Constrictive pericarditis in the modern era: evolving clinical spectrum and impact on outcome after pericardiectomy. Circulation. 1999;100(13): 1380-6. Myers RB, Spodick DH. Constrictive pericarditis: clinical and pathophysiologic characteristics. Am Heart J. 1999;138(2 Pt 1):219-32. Mehta A, Mehta M, Jain AC. Constrictive pericarditis. Clin Cardiol. 1999;22(5):334-44. Hancock EW. Differential diagnosis of restrictive cardiomyopathy and constrictive pericarditis. Heart. 2001;86(3): 343-9. Ling LH, Oh JK, Tei C, et al. Pericardial thickness measured with transesophageal echocardiography: feasibility and potential clinical usefulness. J Am Coll Cardiol. 1997; 29(6):1317-23. Talreja DR, Edwards WD, Danielson GK, et al. Constrictive pericarditis in 26 patients with histologically normal pericardial thickness. Circulation. 2003;108(15):1852-7. Rajagopalan N, Garcia MJ, Rodriguez L, et al. Comparison of new Doppler echocardiographic methods to differentiate constrictive pericardial heart disease and restrictive cardiomyopathy. Am J Cardiol. 2001;87(1):86-94. Oh JK, Hatle LK, Seward JB, et al. Diagnostic role of Doppler echocardiography in constrictive pericarditis. J Am Coll Cardiol. 1994;23(1):154-62. Hatle LK, Appleton CP, Popp RL. Differentiation of constrictive pericarditis and restrictive cardiomyopathy by Doppler echocardiography. Circulation. 1989;79(2):357-70. Oh JK, Tajik AJ, Appleton CP, et al. Preload reduction to unmask the characteristic Doppler features of constrictive pericarditis. A new observation. Circulation. 1997; 95(4):796-9. Sengupta PP, Mohan JC, Mehta V et al. Accuracy and pitfalls of early diastolic motion of the mitral annulus for diagnosing constrictive pericarditis by tissue Doppler imaging. Am J Cardiol. 2004;93(7):886-90. Ha JW, Ommen SR, Tajik AJ, et al. Differentiation of constrictive pericarditis from restrictive cardiomyopathy using mitral annular velocity by tissue Doppler echocardiography. Am J Cardiol. 2004;94(3):316-9. Garcia MJ, Rodriguez L, Ares M, et al. Differentiation of constrictive pericarditis from restrictive cardiomyopathy: assessment of left ventricular diastolic velocities in longitudinal axis by Doppler tissue imaging. J Am Coll Cardiol. 1996;27(1):108-14. von Bibra H, Schober K, Jenni R, et al. Diagnosis of constrictive pericarditis by pulsed Doppler echocardiography of the hepatic vein. Am J Cardiol. 1989;63(7):483-8. Ha JW, Oh JK, Ling LH, et al. Annulus paradoxus: transmitral flow velocity to mitral annular velocity ratio is inversely proportional to pulmonary capillary wedge pressure in patients with constrictive pericarditis. Circulation. 2001;104(9):976-8. Reuss CS, Wilansky SM, Lester SJ, et al. Using mitral 'annulus reversus' to diagnose constrictive pericarditis. Eur J Echocardiogr. 2009;10(3):372-5. Sengupta PP, Mohan JC, Mehta V et al. Doppler tissue imaging improves assessment of abnormal interventricular septal and posterior wall motion in constrictive pericarditis. J Am Soc Echocardiogr. 2005;18(3):226-30. Sengupta PP, Krishnamoorthy VK, Abhayaratna WP, et al. Disparate patterns of left ventricular mechanics differentiate constrictive pericarditis from restrictive cardiomyopathy. JACC Cardiovasc Imaging. 2008;1(1):29-38. Circ Cardiovasc Imaging. 2014 May;7(3):526-34. doi: 10.1161/CIRCIMAGING.113.001613. Epub 2014 Mar 14. American Society of Echocardiography Clinical Recommendations for Multimodality Cardiovascular Imaging of Patients with Pericardial Disease (J Am Soc Echocardiogr 2013;26:965-1012.)
0 Comments
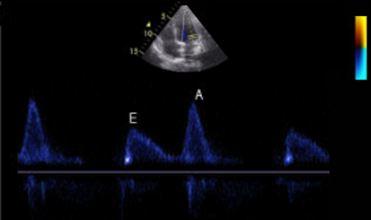 Diastology can often be confusing, as there have many updates to the standards and guidelines regarding how to assess and grade left ventricular diastology in the past few years. So let's dig in to how to assess this and the echocardiographer's role in evaluating diastology based on the updated 2016 ASE Guidelines. So being cardiac sonographers, we should all know the basics... E/A reversal = Diastolic Dysfunction, but there is a little more to it than that. If you're not fully evaluating diastology with additional measures, you're probably missing some positive cases. Also the Intersocietal Accreditation Commission now includes reporting of left ventricular diastolic function as a requirement for echocardiography accreditation. 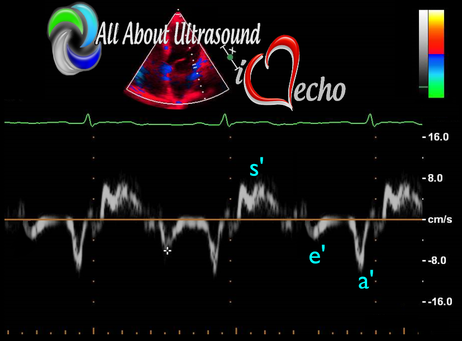 What exactly is diastolic dysfunction? This is a decrease in left ventricular compliance during diastole. While the ejection fraction and left ventricular systolic function are needless to say, pretty important, the diastolic function of the heart is important too. If the heart does not rest properly during diastole, then it cannot fill with the right amount of blood volume needed and eventually this can lead to heart failure and significant clinical implications. So it's important to know the left atrial pressures and end diastolic left ventricular pressures in order to determine the level of severity of the diastolic dysfunction. The updated guidelines break it down like this: Grade 0 = Normal Grade 1 = Impaired Relaxation/Diastolic Dysfunction Grade 2 = Pseudonormalization Grade 3 = Restrictive Pathophysiology So how do we get to the diagnosis? Based on the updated standards from the ASE, determination of normal vs diastolic dysfunction is evaluated initially, based on the patient's EF. If a patient has a normal ejection fraction then the algorithm looks at four components to determine whether or not the patient has a degree of diastolic dysfunction: 1. Average E/e’ > 14 2. e' velocity -Septal e’ velocity < 7 cm/s -Lateral e’ velocity <10 cm/s 3.TR velocity > 2.8 m/s 4. LA volume index >34ml/m2 If <50% are positive, the patient is considered normal. If >50% are positive, the patient has a degree of diastolic dysfunction. If only 50% are positive, then we are unable to determine whether the patient has diastolic dysfunction. If the patient has a compromised ejection fraction, then we can assume that there is a degree of diastolic dysfunction and can grade it based on the E/A ratio. When the mitral inflow pattern shows an E/A ratio <0.8 along with a peak E velocity of <50cm/sec, then the mean LAP is either normal or low and this is considered a Grade 1. When the mitral inflow pattern shows an E/A ratio of >2, the mean LAP is elevated, consistent with Grade 3 diastolic dysfunction. Keep in mind patients with young or athletic patients may show this ratio in the setting of normal diastolic function. Also, patients in atrial fibrillation may exhibit a reduced or loss of the mitral A wave and may also produce similar findings. For patients with reduced EF's that do not meet one of those parameters and the mitral inflow shows an E/A Ratio >0.8 AND the peak E velocity is >50 cm/sec OR E/A Ratio >8 but <2, then other parameters are required for determination of diastolic dysfunction. 1. Average E/e’ Ratio - average E/e’ ratio >14 2. TR Velocity - peak jet velocity >2.8 m/sec 3. LA Volume Index - >34 mL/m2 If 2 of 3 are negative, the patient is considered to have Grade 1 diastolic dysfunction, where if 2 of 3 are positive, then this is considered Grade 2. So, confused yet? Let's look at the grading parameters a little closer. Grade 0 - Normal DiastologyThis means that left atrial pressures (LAP) are normal and the diastolic function is not impaired. The left ventricle relaxes normally throughout diastole and allows for complete diastolic filling. The E/A ratio in a normal setting, is between 1 and 2. This gradually reduces with age and E/A ratio >0.75 may be considered normal above 75 years. 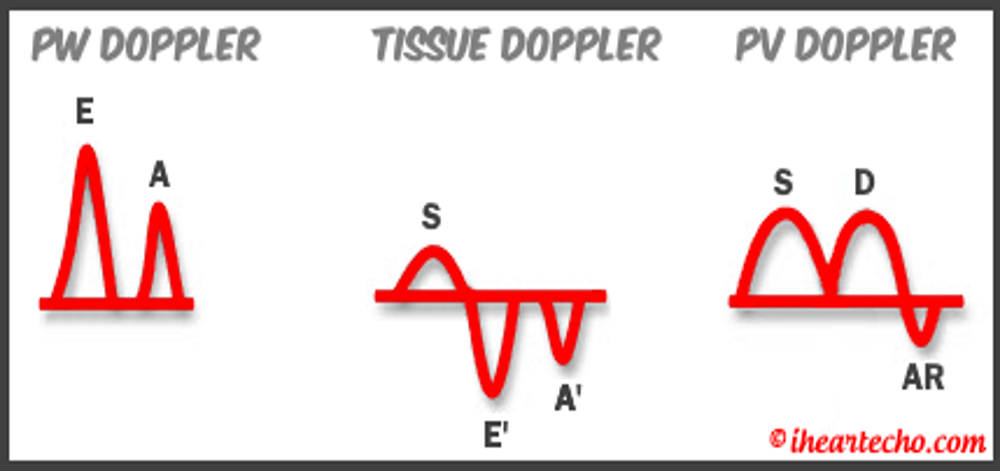 Grade 1 - Impaired Relaxation/Diastolic DysfunctionPatients that do not have a NORMAL EF, will have a degree of diastolic dysfunction and are evaluated based on filling pressures of the left atrium. Left atrial pressures can be somewhat normal in a patient with Grade 1 diastolic dysfunction, but will increased as this progresses. Patients with Grade 1 diastolic dysfunction will have reduced e' velocities and prolonged deceleration time. 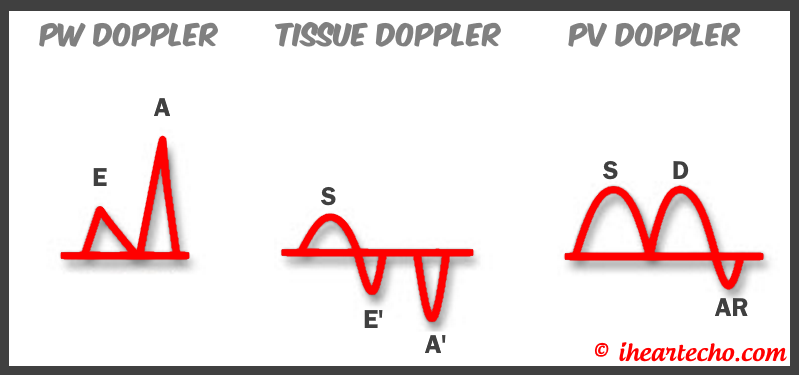 Grade 2 - PseudonormalizationOne of the biggest factors that our role as sonographers requires, is knowing your patient history. This will often help you know whether or not you're dealing with a normal waveform or pseudonormalization. Granted there are some other key factors but the most obvious is whether or not the patient has previously been diagnosed with diastolic dysfunction. If they have previously had reversal of the E/A waveform and now have a normal waveform pattern, this is a pretty good indicator that the patient is in pseudonormalization. Also, keep in mind some of the other factors associated with increased left atrial pressures, such as blunting or changes to the pulmonary venous waveform, as well as reduced e' velocities. When pseudonormalization is present, the valsalva maneuver can assist to "unload" the ventricle and to reduce filling pressures, causing the E/A reversal to be unmasked. 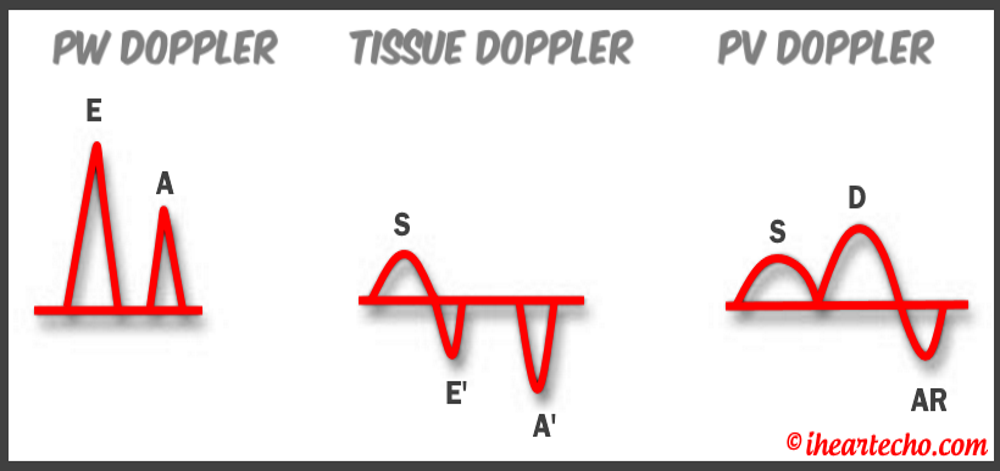 Grade 3 - Restrictive Filling PatternGrade 3 diastolic dysfunction involves increased left atrial pressures and increased end diastolic left ventricular pressure. This may result in reversal of the pulmonary venous waveform and is often seen with the presence of left atrial enlargement and left ventricular hypertrophy. 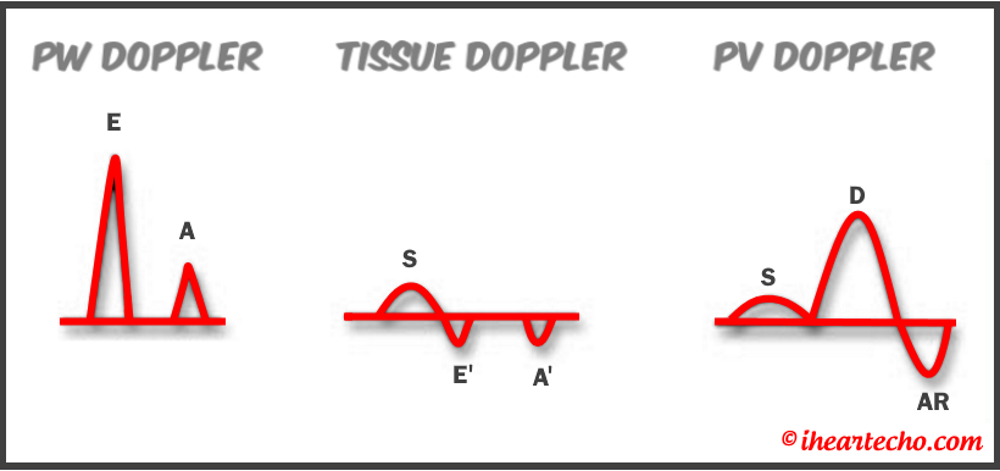 REFERENCE: ASE/EACVI GUIDELINES AND STANDARDS Recommendations for the Evaluation of Left Ventricular Diastolic Function by Echocardiography: An Update from the American Society of Echocardiography and the European Association of Cardiovascular Imaging; Nagueh et al Please note: iheartecho.com is not endorsed by or affiliated with the American Society of Echocardiography Echo Diastology Grading Analysis Tools!The newly updated algorithm for determining diastology and left atrial pressures can be a little overwhelming and difficult to follow, but we make it easy with our Echocardiography Analysis Tools which include our exclusive LV Diastology Assessment Tool! Quickly and easily determine and grade the diastology based on the updated ASE guidelines. Also there are many other parameters that affect diastology and the application of the diagnostic criteria, such as age, athletic hearts and other factors. Learn and review these additional factors and an in depth study of diastolic dysfunction in our MASTERING LV DIASTOLOGY CME COURSE!
I can even remember one day when I had seven patients in a row with moderate to severe aortic stenosis. It can certainly be frustrating and time consuming for inexperienced sonographers to have to take additional images and to add on to our study time. Even experienced sonographers must sometimes take a step back and to remember that these patients need that extra time and attention to further the clinical decision making process for the treating physician and to bring answers and solutions to our patients. We are all human and it is easy to look at our schedules and our busy lives and get frustrated when something throws off our plans. However, treating every patient as though they are our own mothers, our fathers and our friends, will help to put our scanning protocols and requirements in the right perspective. This is the reason we do what we do.... patient care. Above all else, our imaging techniques, protocols and scanning skills should be sharpened and enhanced to further benefit the patients we serve. 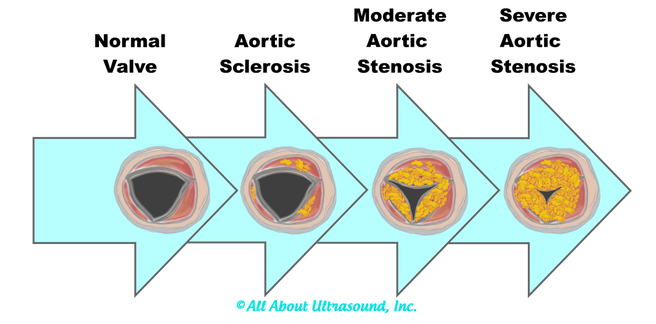 Aortic stenosis is very common in populations over 65 years old and progression of the disease from sclerosis to critical stenosis can take less than 5 years. If you scan in an accredited echo lab, there may be many more additional protocol images to add when assessing aortic stenosis. However, with a few tips and tricks even a very new sonographer can master the art of imaging aortic stenosis and save the frustration of this very common pathology. This is the core of what we do, which is why this is included as a case study requirement for adult echocardiography accreditation through the Intersocietal Accreditation Commission. 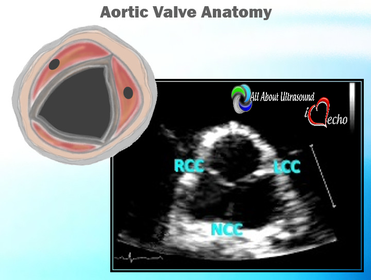 So let's start with the basics... knowing the anatomy of the valve is important when using descriptions of aortic disease. The valve is comprised of three leaflets: • right coronary cusp • left coronary cusp • non-coronary cusp Another core basic item in evaluation aortic stenosis is the Continuity Equation. Having an understanding of the hemodynamics is really the basis for an understanding of the disease process and echo evaluation of aortic stenosis. The Continuity Equation in it's most basic explanation is conservation of mass.... what goes in MUST come out. 
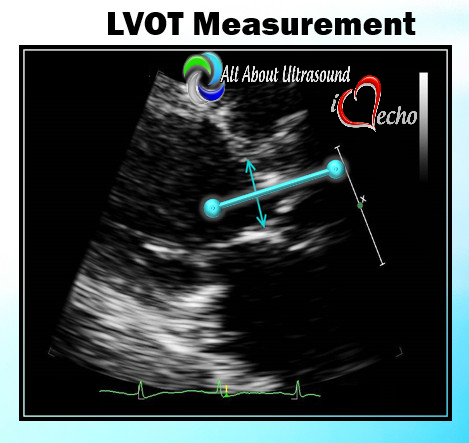
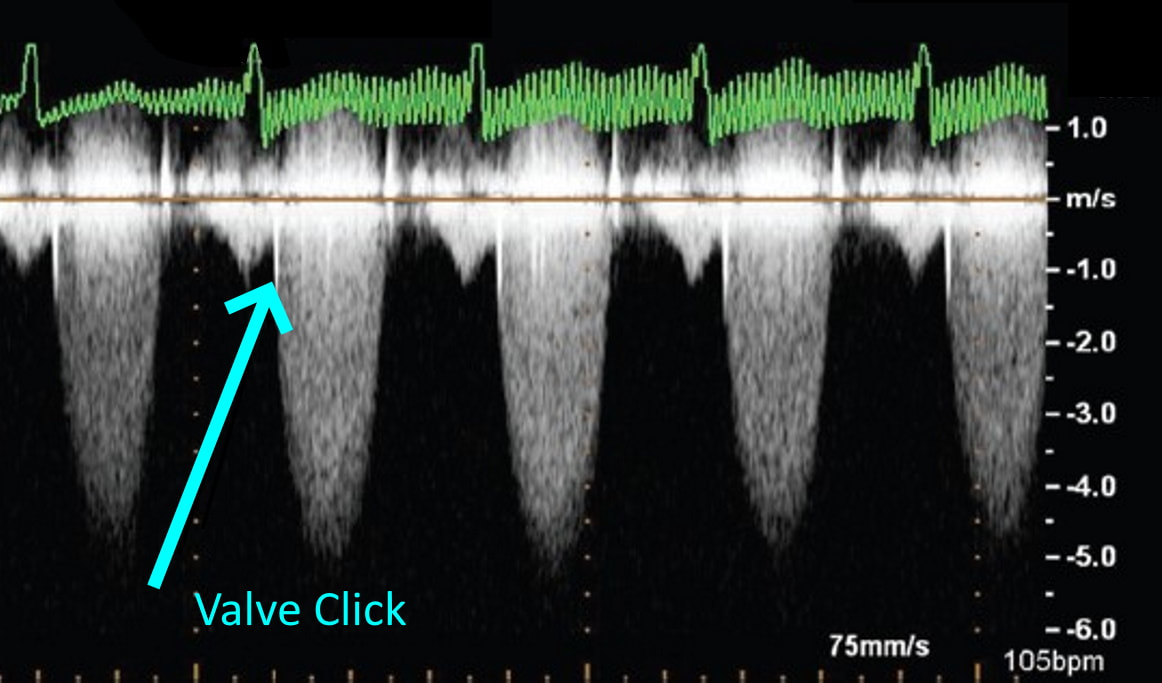
Also, due to the fact that the continuity equation squares the LVOT diameter, this can significantly introduce errors into the equation if that value is only slightly off or mis-measured. It is critical that the sonographer measure the LVOT very carefully and with attention to detail. According to the American Society of Echocardiography the LVOT should be measured with the following parameters and considerations: •Inner edge to inner edge convention •Mid-Systole with aortic valve leaflets open •Parallel to the aortic valve plane •Within 0.5–1.0 cm of the valve orifice •Perpendicular to the axis of flow Doppler angle and sample placement. What more can I say? This is critical to the mathematics. It is important to place the LVOT Doppler sample at approximately the same location as the LVOT diameter is measured from. The LVOT Doppler waveform should also not show significant valve clicks, otherwise Doppler sample placement is too far into the aortic valve. 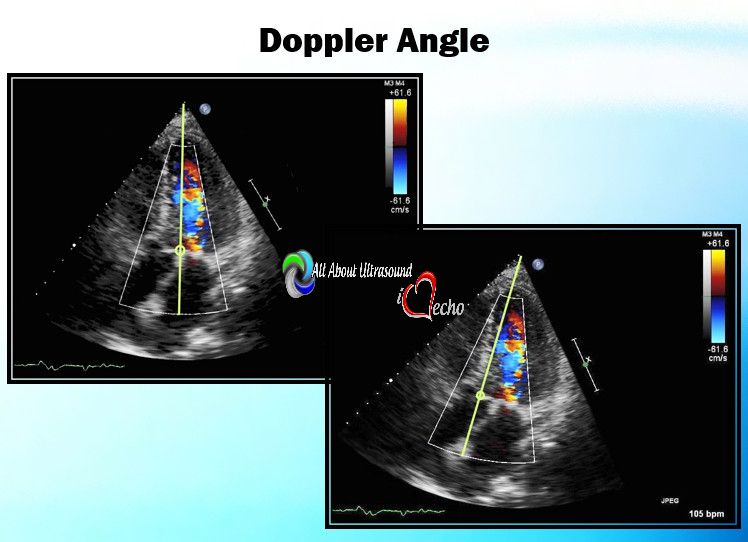 It's important to ensure correct angle THROUGH the aortic valve orifice. In reviewing countless numbers of echo cases through the years for accreditation and quality review, I've seen many aortic valves evaluated incorrectly. It is important to place your continuous wave Doppler sample THROUGH the valve orifice and NOT across the valve leaflets. Simple hand maneuvers and tilting the transducer can open up the LVOT and allow for correct Doppler angle through the valve. Now that you have the basics down, there are few extra steps we can do to evaluate aortic stenosis. Protocols should always include evaluation from the suprasternal notch view, and also evaluation with the Pedoff/dedicated continuous wave transducer. Additional Doppler attempts can also be performed in the subcostal view and the high right parasternal view (always ensuring that true valve clicks are obtained on continuous wave Doppler as this ensures the angle is positioned through the valve orifice). While the pedoff transducer might be scary for some newer sonographers, once you get the hang of it, you'll realize it's really very simple. For the apical approach, start by beginning where you were able to obtain the best apical window of the aortic valve and LVOT. While observing the CW spectral display, listen to the blood flow and isolate one of the typical valve waveform patterns of either the mitral, aortic or tricuspid valves. Remember the aortic valve is in between the two atrioventricular valves so, keep that in mind when adjusting the probe.
LISTEN! Yes listen with audible Doppler. Tuning your ear to the sound of the aortic valve doppler can help to know that you're in the right spot. Also, SLOW DOWN - use very slow adjustments when optimizing the transducer waveforms and trying to bring in the aortic valve. 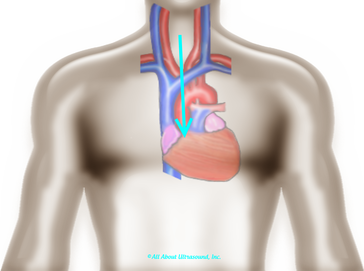 When using the suprasternal notch approach, have the patient extend their neck and try to visualize the position of the ascending aorta and direct the face of the probe at a steep downward angle. One important thing to remember is that because there are no images, you must annotate the location on your images. This is required for accreditation and also just a good practice. 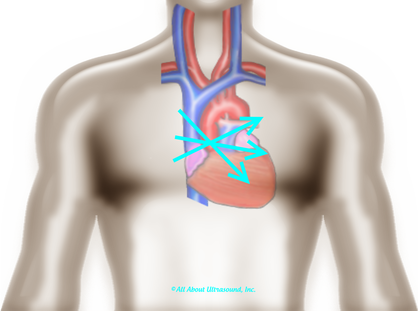 Let's not forget that high right parasternal view! The best patient positioning for this is right lateral decubitus. The patients' arm should be positioned up and out of the way. 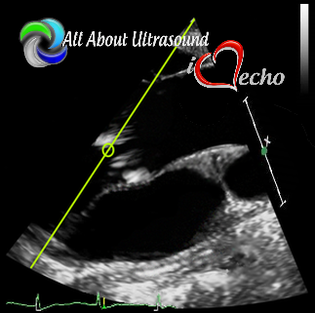 Often it is helpful to find this view with 2D imaging and assess the valve both with the imaging and non-imaging transducers. I suggest that you practice the Pedoff transducer and additional windows on normal patients and practice often when first beginning your echo career... Practice makes perfect! Before you know it, you'll be an AS pro! Blog Author:
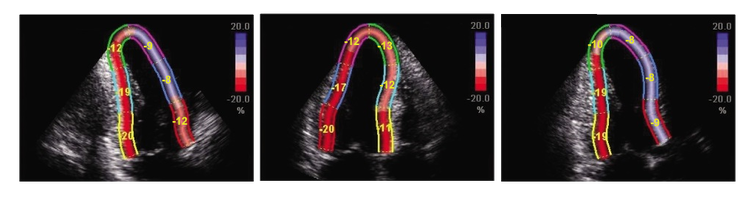
2D Echocardiography sTRAIN IMAGINGTo STRAIN or not to STRAIN!?! That is the question..... 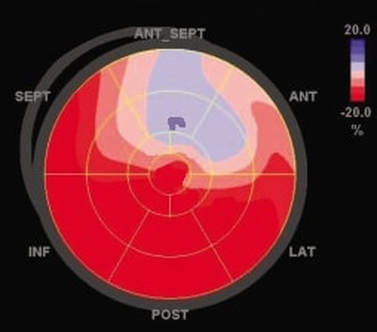 2D Strain imaging has been around for quite some time now, but it seems as though many echo labs still don't use it in day to day echo protocols. This leaves us wondering why?! Strain is useful for so many reasons and has been proven to be more accurate than traditional method of disks ejection fraction measurements when evaluating patients at risk for heart failure. Strain can be highly effective for the detection of cardiotoxicity, with strain abnormalities often showing on echo before there are any measurable declines in ejection fraction or any onset of clinical symptoms. Strain can be a valuable resource to evaluate decreased cardiac function and cardiotoxicity in patients with compromised left ventricular function, such as chemo patients. Many sonographers simply don't understand the benefits of strain and how to best utilize it within the day to day echo routine. The negative values with strain can be a little confusing, but in reality strain is simple and once you have a good understanding of how it works, you will see that it is easy to incorporate this into your lab protocols and is extremely beneficial to your patients.  Left ventricular ejection fraction is the most commonly used parameter of systolic function. It is essential for the management of heart failure patients. The assessment of ejection fraction by Simpson’s biplane, measures changes in volume. It is often limited in sensitivity and reproducibility. Due to geometric modeling and inadequate visualization of the left ventricular apex, as well as measurement variability, this often limits the ability to detect small changes in left ventricular contractility and can often lead to decreased sensitivity and inaccurate EF measurements. Utilization of strain imaging can reduce many of these errors and provide a more reliable assessment. 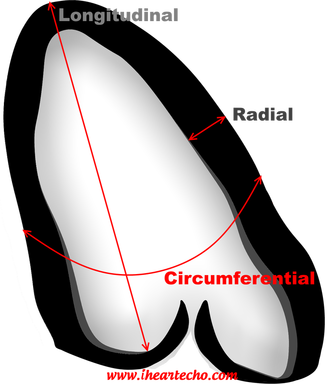 So what is strain? There are three fundamental types of strain or deformation: Longitudinal, Radial and Circumferential. During systole, the left ventricle shortens along the longitudinal and circumferential axis, and it thickens in the radial dimension. Of the three, longitudinal strain has been proven to be the most reproducible. It has also been documented to correlate well with clinical outcomes.  Global Longitudinal Strain assesses the twist of the left ventricle as it shortens along the longitudinal axis. Imagine a rubber band... when the 2 end points move away from each other as in diastole, strain is increased or positive. When the two points move closer together as in systole, strain is decreased or negative. Because of it's negative normal values, many sonographers aren't quite sure of how to assess strain and it can be confusing when you think in positive terms regarding ejection fraction. So what is normal and what do we do with it? Normal global longitudinal strain has a value of -20%. Some literature suggests that values higher than -17% predict severe heart failure or cardiotoxicity. Imaging with strain is pretty simple, if you can get your apical views, you can do strain imaging! Here are a few tips and tricks:
 In summary, strain imaging is a simple tool that can be put to everyday use within your echo lab. Protocols for establishing baseline global longitudinal strain are extremely valuable when evaluating chemo patients for left ventricular function. Strain imaging can be easily incorporated into your daily routine.
Accreditation Updates:
What's new with echocardiography accreditation? The updated IAC Adult Echo Standards were published and went into effect on December 1st. So what do you need to know? The biggest operational change to the standards that will affect your scanning protocols and reporting methods is the requirement of evaluation of left ventricular diastolic function which now must be evaluated through a combination of PW and tissue Doppler techniques. In previous IAC Echo standards, this was an option. It is now a requirement for inclusion in echo scanning protocols. Diastolic function must now also be reported within the final echo report text. While for some, this may be a significant change to protocols and reporting, for others, this has been incorporated in their daily operations for quite some time. Left Ventricular Diastology can be a hot topic with newly updated diagnostic criteria published in 2016. We have you covered for a quick assessment of diastology according to the updated criteria, use our FREE LV Diastology Analysis Tool. Echocardiography Accreditation can certainly be difficult to navigate when there are so many other aspects to running an echo lab that need your attention every day. If you are overwhelmed and need an easy method to simplify your accreditation process and improve quality within your lab, our DIY Accreditation Toolkit can help!  As sonographers, we've all been there... the referring physician enters vague orders because they are just trying to get an echo for their patient and you are left searching for an appropriate indication to perform the echocardiogram. This is unfortunately common place in echo labs across the country. Ultimately ensuring exam appropriateness lies on the shoulders of the sonographer, as we are the last stop before the exam is performed. This leaves the sonographer digging through H&P's trying to come up with something that might meet the criteria and calling the referring physician for clarification on orders.
With Appropriate Use Criteria becoming a factor for pre-authorization and insurance payment, it is evident that education and ease of access to Appropriate Use Criteria is needed for referring physicians and sonographers. The published standards for appropriateness are detailed and thorough and cover just about every aspect of clinical care and exam indications you may encounter in your day to day routine schedule. However, it can be difficult to navigate the details of the standards and guidelines to quickly determine appropriateness with 7 STATS and 3 TEE's waiting when you walk in the door. So that's where we come in. Our FREE (yes you read that correctly... FREE) Appropriate Use Criteria analysis tool helps referring physicians and cardiac sonographers quickly get the information they need to determine appropriateness. Just plug in your indications and we do the rest. The corresponding appropriateness level is displayed quickly and easily, saving you time and streamlining patient care. Whether you need to search this quickly before ordering an echo or you are doing an Appropriate Use Criteria review for accreditation, this can save you time and simplify this once very tedious task. Our simple analysis search tool is free to use. You can find it HERE. If your facility needs a more detailed report of AUC results for accreditation or internal tracking, our DIY Accreditation Toolkit includes this option with quick data entry and tracking. Also use our DIY Accreditation Toolkit to implement a Quality Improvement Program with tracking of employee and physician Quality Scores. Set a benchmark and track quality in the lab. Identify key areas for training and learning opportunities. Our detailed quality tools will help you set a standard of excellence for your lab. Learn more about that or start your FREE 7 day trial HERE. 2011 Appropriate Use Criteria 2017 Appropriate Use Criteria for Multimodality Imaging in Valvular Heart Disease We are working hard and this site is under construction! Keep an eye out... iheartecho.com is almost ready and is coming soon! In the meantime, check out the new facebook group iheartecho for case studies, peer to peer discussions, resources, tools, tips and more at https://www.facebook.com/groups/iheartecho/ Or head on over to All About Ultrasound for other echo and ultrasound related resources! #iheartecho  |

iHeartEcho is a division of All About Ultrasound, Inc. and was created as a resource tool for cardiac sonographers, recognizing that echocardiography is aunique and dynamic focus of ultrasound. For our Diagnostic and Vascular Ultrasound Blog - See us on All About Ultrasound. Archives
July 2019
Categories |


 RSS Feed